
22 min read

Last year we visited the topic of inflation, and wondered if, after a decade of false alarms, the extraordinary dynamics around the pandemic and the policy response to it would finally herald the return of inflation to the forefront of investors list of concerns. That day has now arrived, after April’s above-consensus 4.2% year-over-year headline CPI print, inflation topped by the list of tail risks that worrie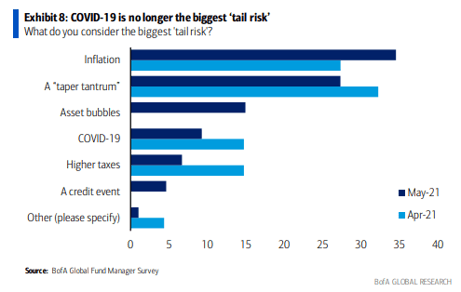 d fund managers surveyed monthly Bank of America. We titled our piece last July “Will the Dog Bark This Time?” given the former characterization of inflation as “the dog that didn’t bark.” Thus, we chuckled when JP Morgan recently likened the Federal Reserve’s surprisingly quick attainment of its long-sought “catch-up” inflation to “the dog that caught the car.”1 Canine metaphors abound. Now that inflation appears to be finally with us, two new questions emerge: “will it last?” and “what should we do?” Naturally, we have been discussing those questions with clients and at weekly investment committee meetings throughout the spring. Here are some of our thoughts.
First, the recent numbers. Monthly inflation data exceeded forecasts again in May, with the headline reading rising from 2.6% in March to 5.0% in May, against a median forecast of 4.7%. This followed a large surprise in April, when CPI registered 4.2% against a median forecast of 3.6%. The “core” number, which strips out typically volatile food and energy prices, rose 3.8% year-over-year in May. This was the highest core CPI rate in 29 years. The Fed has told markets that it will look past short-term bouts of inflation that it deems “transitory,” and will instead focus on slack in the whole economy— business and financial conditions, capacity utilization, and chiefly, proximity to full employment—before pulling any tightening levers. It has also indicated that it will tolerate some degree of faster inflation in order to recover ground lost during the recession. Some are urging the central bank to act sooner, to taper its current program of asset purchases before the economy overheats and causes policymakers to truly lose control. Some on the committee appear to be listening and have suggested that a “taper timeline” may be discussed as soon as the June meeting. Antennae will be tuned closely to the Fed’s press conference on the 16th to hear if Jerome Powell is ready to begin to “talk about talking about” tapering.
As we wrote last ye ar, there are both short-run and long-run dynamics driving inflation that operate differently. In the short run, April’s spike was clearly caused by the rapid pace of the American economy’s reopening, as demand surged for many items that are temporarily in short supply. Newly vaccinated consumers have unleashed a torrent of pent-up demand on production and supply chains unready for the burst. Many have remarked the alarming price charts for industrial commodities like copper and steel, or lumber for housing construction, or the
 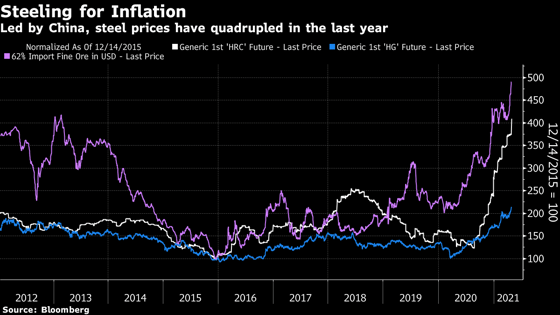 spiraling wait times for vital inputs like semiconductors. These rising input costs are reflected in producer price indices and manufacturer prices paid indices which are rising even faster than those seen in consumer baskets. Looking within April’s surprise number, the fine-grain details were consistent with the strains of a rapid reopening: hotel lodging prices were up 7.6%, airfares up 10.2%, and used car prices up 10%. Most of these more sensitive categories showed no let-up in May. Stripping out the most volatile components result in a “trimmed mean” core PCE rate of only 2.4%. High annual rates of change are also exaggerated due to base effects; the economy was in a lockdown-induced coma last Spring, so prices are up a lot on a year-over-year basis. Over a two-year horizon, prices have thus far been increasing at below a 2% CAGR2. Overall, the story is one of stimulus and shortages.
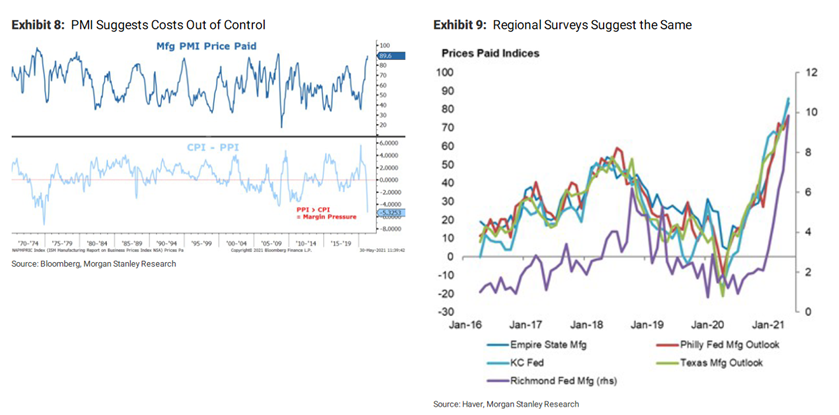
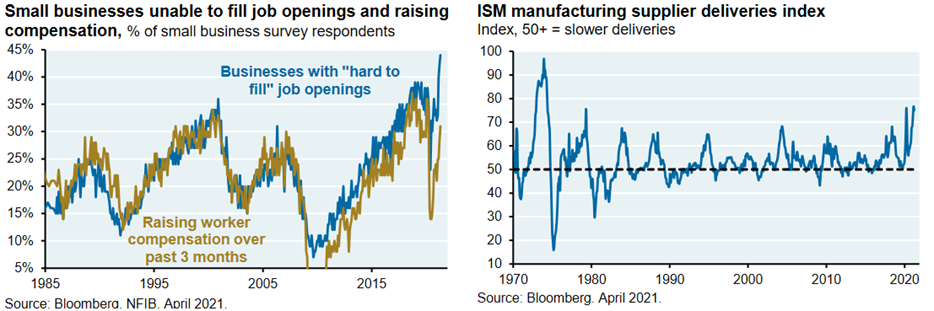
Housing in particular is in a state of structural undersupply. As the consumer-focused policy response to the pandemic has lowered mortgage rates and buttressed already-healthy household balance sheets, conditions were ripe for home prices to surge by double digits. This 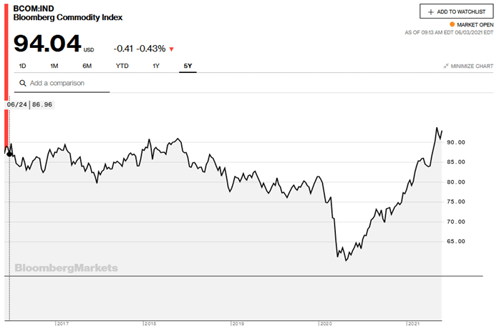 has yet to be reflected in the CPI’s calculation of “owner-equivalent rents”, but bears watching. Furthermore, the rebounding service sector, reflected in the leisure and recreation components of the CPI basket, depends critically on one input—(relatively) low-skilled labor. With extended unemployment insurance benefits and continued fears of coronavirus at work, businesses have had to raise wages to entice workers out of their homes. Many of these special benefits are due to elapse in September, and some Republican-led states are ending their generosity earlier.
 Source: J.P. Morgan Eye on the Markets, May 24, 2021
(https://am.jpmorgan.com/us/en/asset-management/institutional/insights/market-insights/eye-on-the-market/inflation-duh/)
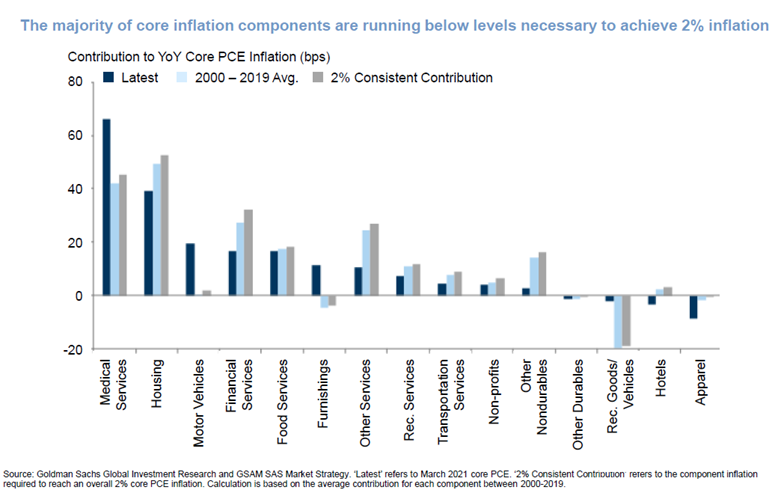
We believe the Fed is justified in “looking through” some of the noise in the spikier inflation indicators. We are very much in an unprecedented historical episode; there are bound to be strains and adjustments as the economy recovers its footing. Supply bottlenecks may persist throughout the summer, but 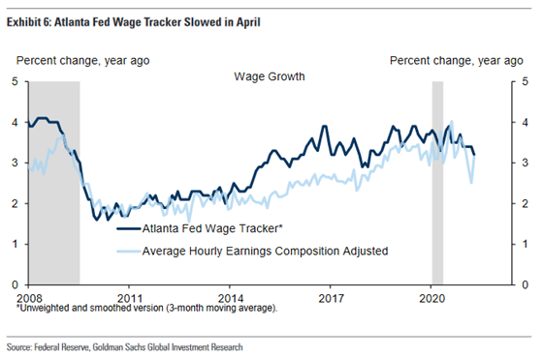 production eventually comes online, logistics chains reorient and a new equilibrium is established. Look no further than the great toilet paper shortage of 2020. Already there are some signs of moderating lumber prices and wage growth actually slowed from March to April, as tracked by the Atlanta Fed. Moreover, the acyclical components of inflation—e.g. those less sensitive to reopening pressures—are consistently running below the Fed’s 2% long-run target. Consumer durables, apparel, and digital goods are examples of categories where the prices we pay that are either flat or in outright decline.
So, why worry? Are market jitters just a natural, healthy reaction to the prospect of a sooner-than-expected shift from extraordinary monetary accommodation to a policy that could be described only as “expansionary”? Market-based measures of inflation compensation have been rising since mid-2020, and the U.S. yield curve has undergone a dramatic bear steepening before moderating in recent months. Inflation-talk and equity market volatility would appear simply to be catching up to the reality that the bond market has been anticipating at least since December. While we think much of the short-run noise will resolve over the course of the year, we believe there are several risks to the long-run inflation outlook that multi-asset investors ought to care about. These have been discussed nicely in recent interviews by Goldman Sachs’ chief U.S. economist David Mericle and they fall generally into three types: wage-price spirals, structural imbalances, and expectations. Let’s address each of these in turn.
- Wage-price spirals. In recent years, the Phillips curve has been remarkably flat. This has led many economists to revise their models of how wages—through a measurement called “unit labor costs—ultimately get into prices. Many reasons have been given for the lack of upward wage pressure: structural inequality, decreased labor share from employer monopsonies or reduced collective bargaining, to outsourcing and global labor arbitrage. Before the pandemic, wage growth was running around 3%--not spectacular, but ahead of overall inflation. With much of the market effectively accomplishing President Biden’s “push-for-$15” without the president having to lift a pen, it appears that some of these forces may be going into reverse. Even though the unemployment rate is currently 6.1%, the labor economy may be actually much tighter than that, thanks to factors such as unemployment benefits, skills gaps, or declining labor force participation. Even the weak April jobs report was attributed to mismatches between employers’ needs and UI recipients’ disincentives to put themselves in harm’s way. If such workforce bottlenecks continue, the supply of labor may not be able to readjust as easily as semiconductor factories. Wages might rise faster than expected for many quarters, if not years. Runaway wage growth would naturally eat into companies’ margins, but as many American employers have significant market power, the costs could be paid largely by consumers instead. This would be, ipso facto, inflationary. While high-profile wage increase announcements from retailers and restaurants have been coming thick and fast during the spring, these stories so far serve more as an expanding corpus of anecdote than as systematic evidence. The broader path of wages and the shape of the Phillips curve will however bear watching over the course of the next several quarters.
- Structural imbalances. In this group, we would inelegantly lump both chronic shortages like affordable housing in job-producing cities, chronic supply-side pressures and the dynamics of persistent budget deficits. As we wrote last year, the fiscal response across the developed world to the crisis of 2008 was insufficiently vigorous. After one round of (politically downsized) stimulus, governments shifted to a diet of austerity and budget-balancing. Meanwhile, the private sector spent a decade rebuilding its balance sheet rather than spending. This time, governments have learned better. Janet Yellen, Obama’s Fed chair and Biden’s Treasury secretary, has urged policymakers to “go big” in their response to the pandemic. The risk, in the administration’s view, lies in doing too little, not too much. The Fed’s more relaxed attitude around inflation and its willingness to deploy all manner of tools quickly averted a steeper crisis in the wake of Covid-19 but also flooded financial markets with liquidity, helping set the stage for such excesses as meme stocks and SPACs. While the scale and targeted nature (checks to consumers) of the fiscal response was undoubtedly appropriate in the midst of potentially the worst economic crisis of a lifetime, there are legitimate questions about whether plans to spend upwards of $6 trillion into an economy that appears to be growing faster than 6% risk exacerbating supply-demand imbalances and sending inflation shooting skyward. It should be noted that multipliers on government spending in such an environment are generally less than one, and much of the contemplated spending on physical and social infrastructure is meant to be paid for by tax rises, but even $2 trillion in extra spending could close any remaining output gap, and push both inflation and real growth well above their sub-2% trend levels of the past decade. This would pose a dilemma for a central bank committed to keeping policy rates easy for “as long as it takes”.
Housing appears to be one sector of the economy where supply is not flexible enough to meet buoyant demand. Low mortgage rates, consumers’ flush bank accounts, and a pandemic-inspired urge to splurge on domestic comfort have combined to meet multiyear lows in inventory and send home prices up double-digits. So far, while the cost of purchasing a home is soaring, rents are not. And, importantly, while real and imputed rents are counted in the inflation basket, house prices are not, at least directly. Home prices and rents typically move together, with the more volatile housing series often leading rents. After landlords work through much of the jobs carnage that has disproportionately affected renters, they may begin raising the rent again. The Swiss Bank UBS ranked rents as the greatest single risk to U.S. inflation and hence to financial asset prices.
- Inflation expectations. Here is where the science of inflation forecasting ends and the art begins. Inflation is, even more than other macroeconomic aggregates, an emergent social phenomenon. Through many different channels, inflation perceptions can become fundamental reality; the map becomes the territory. If many of the drivers of the recent inflation numbers are benign or transient, inflationary expectations that become entrenched can still drive further experience of actual inflation in a self-fulfilling prophecy. This is the kind of complex feedback that gives researchers pause and while many forecasters see in the recent inflation data evidence for its ephemerality, the role of expectations makes even the most tightly specified model inescapably murky. Mericle worries that “[P]rice rebounds and reopening industries and temporary supply shortages… really do turn out to be temporary, but they make such a big impression on people's inflation expectations that via our sense of what is a normal inflation rate, it becomes self-perpetuating.”
The Keynesian and monetarist macroeconomic traditions are alike in ascribing a central role to expectations in governing the speed of the economy. They differ in the degree to which they allow policymakers to manipulate those expectations. In the Keynesian view, economic agents are myopic, and may mistake short-run fluctuations, perhaps driven by policy stimulus, for structural shifts in potential activity. Monetarist counter that individuals hold “rational expectations” and suffer no long-term money illusion. They apprehend that a dollar spent by the government today is a dollar the government must tax tomorrow, and thus makes them no wealthier. Regarding the current inflation debate, either side could be right; yet inflation still matters. If inflation is transitory, perceptions may still lead consumers to permanently adjust their behavior. If rational expectations theorists are right, and inflation is here to stay, actors in the economy will perceive it and shift their consumption and production functions no matter how many assurances central bankers offer that today’s price rises are transient. The Fed, in trying to guide beliefs above its target, will be “mugged by reality,” and will lose its 2% anchor. Keynesian doctrine, by contrast, has long blamed recession on the downwardly sticky nature of wages; firms cannot cut wages when gross output falls, because workers will not accept a pay cut. It has been proposed that wages may be upward sticky as well. If that’s true, pay hikes due to ephemeral labor market logjams could widen out and become a source for persistent inflation.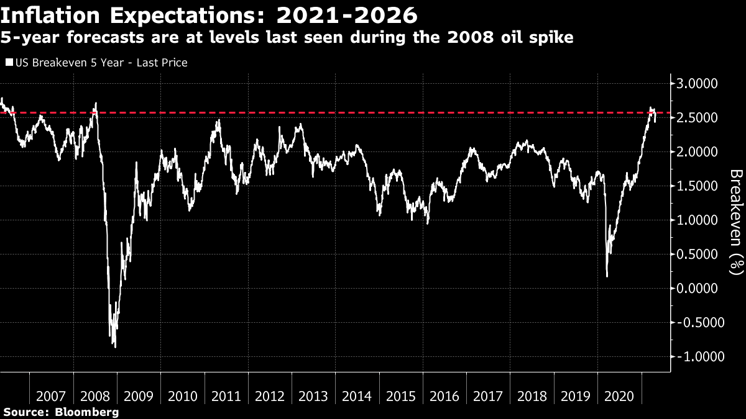
There are, broadly, three ways to measure inflation expectations. Market-based measures, as mentioned above, use Treasury Inflation Protected Securities (TIPS) to back out the implied extra inflation protection demanded by investors over nominal bonds. These so-called “breakevens,” measured usually at five- and ten-year horizon, have risen steadily throughout 2020, and formed something of a plateau around 2.5% for 5 and 10-years. Fed chair Powell has said that this sort of expectation is desirable, as it dovetails with expectations for stronger growth that influence firms’ hiring and expansion decisions. Tepid inflation is as self-reinforcing as the brisker kind. Indeed, in the U.S. and globally, we are seeing evidence of the sort of investment and capex-led recovery that has been largely absent throughout the last several cycles. 2.5% is higher than expectations have been for a decade, but that might just be a good thing.
There are other ways to account for inflation expectations than through financial market prices. The Philadelphia Fed compiles a much watched survey of professional forecasters—economists who look at the
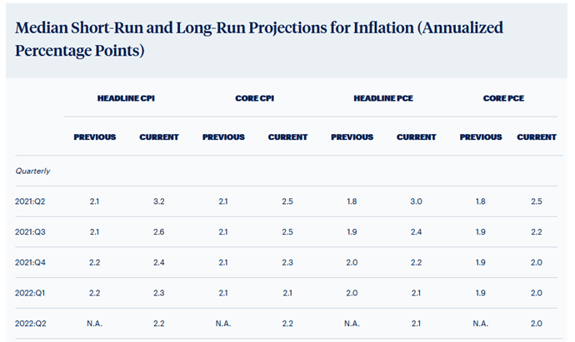 fundamental drivers of inflation and make predictions, often for corporate clients. Short-term estimates have lately jumped in-line with actual data, suggesting that forecasters are following the trend upward. While professional forecasters have been notable recently for their failure to predict a decade of lowflation. Now those forecasts are ticking up again. But median forecasts here too trend downward into next year, confirming the market’s view that inflation is likely to remain somewhat elevated above 2%, but not alarmingly so.
Source: Philadelphia Fed 2nd Quarter Survey of Professional Forecasters
(https://www.philadelphiafed.org/surveys-and-data/real-time-data-research/spf-q2-2021)
The third way to look at inflation is surveys of the people actually facing inflation in final goods and services: consumers. The most famous such consumer survey is run by the University of Michigan. This number’s reliability as a gauge of future inflation is debatable, and is used more as an indicator of consumer behavior and purchasing decisions. It reached a high of 5.1% in July 2008, just before the collapse of Lehman Brothers set off several quarters of deflation. One month before that reading, the price of Brent crude had reached $140 per barrel, which underscores an important characteristic of consumer surveys: they tend to reflect not the weighted average price of the basket the consumer actually encounters (financial services and healthcare costs are often hidden, for example). Instead they overweight the most salient items, which in the United States’ car-friendly culture, is often the price of gasoline at the pump. With that noted, the University of Michigan survey in April ticked a 9-year high of 3.4% as gas prices rose on average from under $2.00 a year ago to over $3.00 today. Amid the current climate of rejuvenated global demand and unprecedented OPEC production discipline, these fuel prices will surely be further tested; however, they too will likely moderate by the end of the year.
 Source: Google Trends (https://trends.google.com/trends/?geo=USpf-q2-2021)
The risk of self-fulfilling inflation loops is most acute when consumers feel the pinch. Their buying habits, their wage bargaining, and their social interactions determine the psychology underlying a more permanent change in the inflation regime. Right now aggregate expectations are probably where the Fed wants them to be—implying a rapid recovery from a very deep crisis, but remaining anchored close to 2% and showing little sign of significant second-round effects. If the tether stretches further—for example if 4% appears baked into to investors’ or economists’ forecasts for any length of time, the Fed will need to emphasize that it stands ready to reel in its stimulus. This will cause some degree of disruption in stock and bond markets. Many markets are not priced to easily digest a sudden policy shift. This is a near-term risk for investors.
Some clients have asked us if we see a risk of 1970’s style, double-digit inflation. It’s hard to know what can set off such a cycle of positive reinforcing feedbacks, though we refer such questions to our work from last year contrasting the current environment to previous episodes of inflation. To summarize our views, current monetary conditions, expansive as they are, are not alone sufficient to trigger high levels of inflation. Loose monetary policy would need to work in concert with elevated private demand, major supply shocks, tight labor markets, a structural lack of adjustment mechanisms (e.g. substitute goods), and sustained commitments to fiscal spending. While the fiscal center of gravity appears to be shifting away from the deficit hawks, both in Europe and America, the term “sustained” is important. In order to run government demand consistently ahead of supply so as to set off a mechanism of self-reinforcing price rises, governments must seem ready to spend more every year. As long as “stimmie” checks are seen as temporary pandemic relief, their influence is probably short-lived.
Balancing the policy impulse are secular forces that have held down inflation for decades. Among them are the famous three “D’s”: debt, demography, and disruption. We and others have written about these forces before so we won’t elaborate much here. Debt service crimps spending; aging demographics slow productivity gains while inequality lowers aggregate spending; technological disruption results in falling equipment costs and more comparison shopping. Some of these factors may be going into reverse; it is worth thinking about that aging societies will likely draw down savings to spend more on less productive, more inflation-sensitive items like medicine and old-age care. This consumption shift could be inflationary rather than disinflationary. Furthermore, the pandemic has sent globalized supply chains into regional consolidation and has helped fuel shortages (such as for semiconductors, silicon wafers, or the nickel, copper, lithium, and rare-earth minerals that go into much of the “clean” tech needed for decarbonization). For a change, these shortfalls may send the prices of high-tech capital goods up, not down. But near-shoring supply chains and reversing inequality take time, and many of the dislocations caused by Covid-19 will fade. Higher inflation seems probable, but the weight of recent evidence cautions that some disinflationary anchors remain.
So, our answer to the question of if 10%+ inflation is in the cards is “not likely”. That does not mean something scarier than the scenarios outlined above cannot happen. Credible estimates suggest that much higher inflation than is currently estimated are possible. We view a large inflation surprise in 2022 or later as a tail risk. Not a base case, but worth preparing for nevertheless. At the start of this essay we asked two questions: “will it last?” and “what should we do?” Our answer to the former is that inflation is likely to moderate throughout the year as the acceleration of the reopening shifts to deceleration, but that inflation will likely remain above its recent averages for some time. A period of even higher, mid-single-digit inflation rates is an outside risk. This leads to the question of “what should we do?” How do we protect portfolios for a more inflationary future?
Conventional wisdom holds that equities and real estate are good “hedges” of inflation. Stock prices tend to rise with inflation as they are essentially bundles of discounted real earnings. Real estate 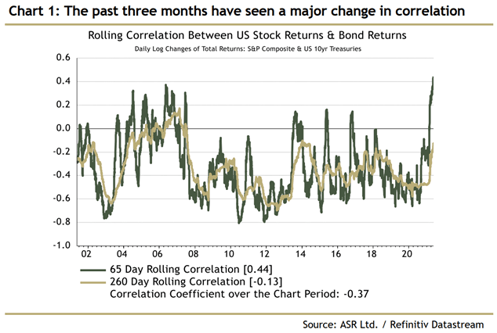 keeps up with inflation because of the ability of landlords to increase rents, and because of the fixed supply of land. It should probably be clarified that stocks and real estate are not truly “hedges” but rather traditionally perform better during a period of rising inflation than long-term bonds. There is no reason that stocks, bonds, and real estate cannot fall together. If an inflation surprise forces policymakers to raise interest rates faster than the market had anticipated, bonds will fall, cap rates will rise quickly depressing the value of real estate, and equity earnings will need to be discounted at a higher rate, depressing valuation multiples. Indeed, the putative negative correlation between stocks and bonds is largely an artifact of several decades of tame inflation. Correlations can go positive, as they did during the 1970’s and appear to be doing today.
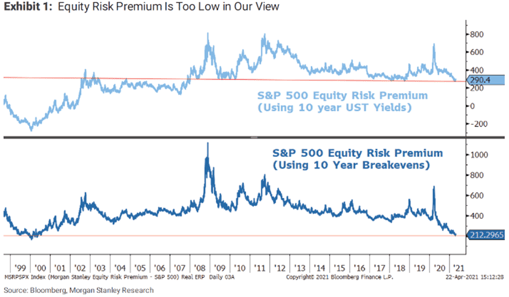
High equity valuations have been rationalized in terms of comparisons to bond yields. The trouble is that bond yields appear artificially squeezed by emergency policy. If that policy needs to be reversed earlier or faster than the stock market has anticipated, P/E ratios have lots of room to fall. When compared to the main risk fixed income investors face— inflation—stock market multiples are pricing in, shall we say, heroic rates of earnings growth (or a very abrupt end to inflation). In fact, when Morgan Stanley strategists computed the equity risk premium (the expected return on stocks minus the risk free rate) using inflation break-evens rather than the 10-year Treasury yield, they found it about matched the lowest on record3. That is, the excess compensation derived by equity investors for the risk they take beyond what the could fairly be expected for government bonds is as small as any time since the 1990s tech bubble.
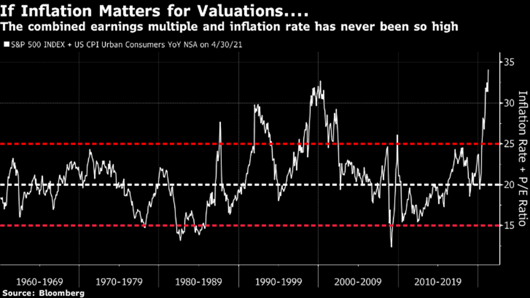
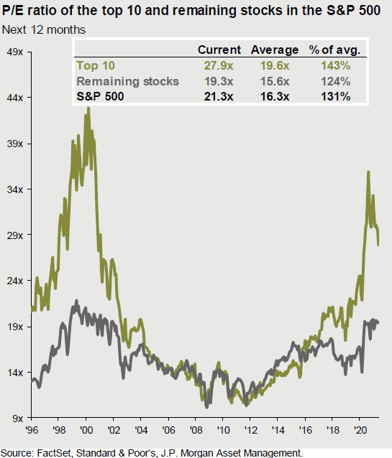 At 21 times forward earnings, the S&P 500 does not look especially resilient to a spell of unexpected inflation from a valuation point of view. Earnings growth in 2021 so far has blown away consensus estimates, though its pace should relax by the third quarter. Yes, the earnings power of the biggest tech stocks probably suggests that historically high valuations are somewhat justified, but the top 10 largest stocks in the S&P 500 command a forward P/E ratio of 27.9x. Investors now find themselves in the uncomfortable situation where stocks priced at 25 times have earnings yields (4%) that aren’t even keeping pace with inflation! Valuation dispersion within U.S. stocks is very high due to the profound changes wrought by the pandemic and by technology, and may need to compress further. Investors can play this mean reversion through style and sector rotation—again, an emphasis on value plus quality seems reasonable.
Of unique concern to stock investors today is the ability of busin esses to maintain profit margins as input costs, from labor to materials, surge. Stock sectors with higher profitability and the perceived ability to pass through cost increases have recently performed better than those with less salubrious margins. Financials and commodity stocks, for example, are seen as likely beneficiaries, and some believe that consumer staples companies are also well equipped to pass along higher prices. As earnings swell along with a red hot economy, equity valuations have begun to stall. Entering the year, stock investors were positioned for a rising tide to lift all boats; the smaller and leakier the boat, the better. Now a rotation may begin to emphasize quality as well as value; profitability and financial strength matter more mid-cycle than they do in the early days of a recovery.
One interesting feature of the current recovery that we briefly mentioned above is the high amount of corporate investment that seems to be accompanying it. Perhaps business leaders are responding to expectations of major investments in infrastructure and social safety nets by governments, and the level of demand that will guarantee. Perhaps the mood and the time horizons of chief executives have shifted over the course of the pandemic. Either way, two graphs from Morgan Stanley and the Economist illustrate that capex is running much higher than in previous cycles. The technology sector has often been a leader in investment; this time capital spending is showing more breadth.
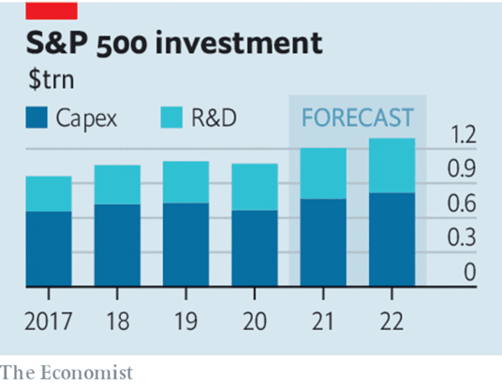
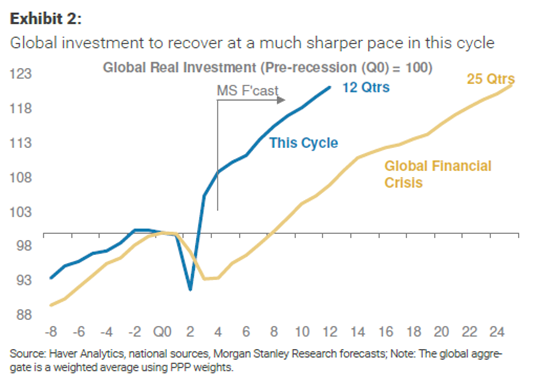
What are the implications of an investment- rather than a consumer-led recovery? One is that companies might see lower cash-flow margins in future, though perhaps higher rates of revenue growth. From a macroeconomic perspective, more investment implies GDP growth,  but also rising productive capacity. For all the worries about output gaps slamming shut, more capital expenditure on factories, warehouses, data centers, 5G networks, and software, alongside more R&D and more government spending on green grids and public transportation together all mean higher potential GDP. Already remote working and telecommunications technologies look set to lead to productivity boom, at least among white collar workers. In the short run, a flurry of spending might cause demand to outstrip supply. Over the full cycle, one would want to be exposed to this growth, probably in the form of equities. The challenge before asset allocators today is how to navigate the transition from deep recession to red hot expansion.
Of course, if stocks and bonds can both fall together, investors will want to consider real assets. We have long been champions of real estate, though with interest rates poised to rise, location and management value-add become even more important. The ability to push through rent increases will be concentrated among the owners of the most in-demand properties. Real (physical) assets such as farmland, timberland, power, transportation and shipping comprise another category, usually called “infrastructure”, which serves a similar function to real estate in providing steady cash income as well as diversifying equity market risk.
There are of course such things as commodities—an asset class some readers may find it strange we have neglected thus far to mention. Our view has been that investments with little or negative intrinsic yield should be used sparingly, foremost as hedges or diversifiers in a balanced portfolio. Over time, through periods of high and low inflation, equity and equity-like investments have been key to growing wealth. Commodities are subject to volatile swings of supply and demand, requiring that investors who place large bets have unique macroeconomic insight or short-term trading prowess. Commodities and currencies can serve as a portfolio hedge, though hedging efficiently and at the right time, takes tremendous skill. Therefore we champion portfolios that seek inflation protection largely through well diversified equity holdings and to limit such macro bets to a small portion of total assets.
We have taken 4,000 words and two dozen charts to make a number of rather simple points. Inflation is running higher as a consequence of an extremely robust economic recovery. That recovery has been aided by substantial policy stimulus, and is increasingly broad based. It is natural to expect some bottlenecks and traffic jams. Asset price volatility always ensues when investors digest rapid change. At present, there is every reason to trust the Federal Reserve when it expects that a period of high inflation will be transitory. But as supply pressures diminish the economy will transit to regime of more fiscal support, a less aggressive monetary reaction function, and perhaps more investment and less inequality. These are generally developments to be welcomed, but which also augur inflation rates higher than those to which we have become accustomed. If policymakers avoid a significant error, and if a major supply shock (likely in the form of industrial and agricultural commodity prices) can be avoided it should be possible to keep inflation expectations contained. With inflation forecast to run a bit hot and then to moderate throughout 2022 and 2023, the Fed may see itself sitting in a sweet spot. Over the next several years, most signs point to inflation moderately but not dramatically greater than two percent. This is a consummation devoutly to be wished. The sweet spot could turn into a hot seat in the span of a quarter or two, and policymakers will need to act to reassure markets. We will prepare for the risks of something worse, and steer clear of assets (for example long-term bonds and mega-growth story stocks) priced for perfection. And we will watch inflation indicators closely as data come in throughout the year. On the whole, however, while cautious around inflation expectations, we view the medium-term outlook fairly optimistically.
1 J.P. Morgan Economic Research, “Global Data Watch.” Research Report. May 21, 2021.
2 “CAGR” = Compound Annual Growth Rate.
3 Morgan Stanley Equity Strategy, “Weekly Warm-up: Supply Shortages Abound; Stick with Quality as Market Narrows Further.” Research Report. May 10, 2021.
Related Posts
Inflation: Will the Dog Bark This Time?
Inflation: Will the Dog Bark This Time?
Time to Buy?
No. Decades of low inflation and falling real yields pushed up valuation multiples across all...
Investment Strategy: a Major Reset
- The Fed clearly sees more risk coming from higher inflation than it does from a potential...