
20 min read
A global approach to portfolio construction
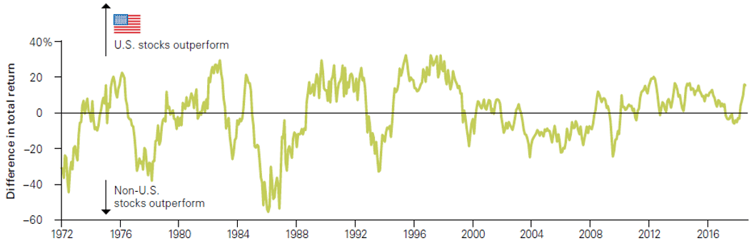
Image source: Vanguard (https://www.vanguard.com/pdf/ISGGEB.pdf)
The average U.S. investor allocates roughly 80% of their equity portfolio to their home market, even though domestic stocks comprise just over half of the global index. Why do many American investors focus so heavily on the U.S. market and, more specifically, on the large blue-chip companies that dominate the S&P 500 Index? It could be that the U.S. is home to many of the world’s most innovative technology companies—those software and internet firms that have grown so rapidly coming out of the Great Recession. Many investors have come to believe this golden era for U.S. stocks will continue indefinitely. The S&P 500 Index soared nearly 400% during the 2009-2020 bull market, while international stocks (measured by the MSCI ACWI-ex U.S.) added just over a third (143%) of that amount over the same period. Leadership between the U.S. and international stocks has shifted in multiyear cycles, with international stocks’ last period of dominance occurring over a decade ago prior to the Great Recession.
Taking one measure of innovation, in 2018 the United States was not even in the top five countries worldwide of patent applications per unit of GDP and has only one company in the top ten. This suggests that technological leadership is not the sole explanation for the U.S. stock market. Recent U.S. equity leadership has been increasingly concentrated only in a few stocks, and while Microsoft, Amazon, and Nvidia have performed tremendously well, the likes of Tencent, Alibaba, and ASML Holding are catching up.
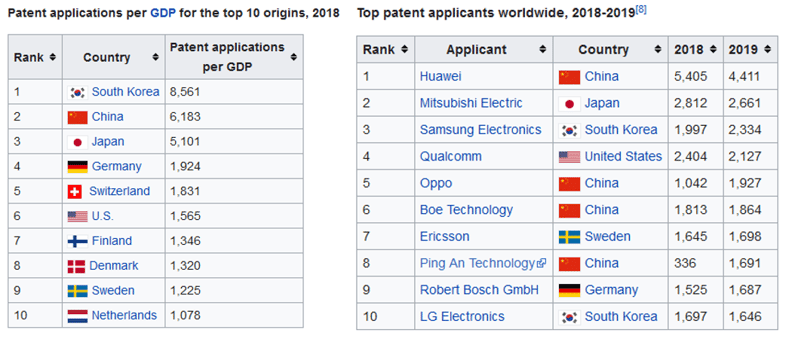
Source: Wikipedia, World Intellectual Property Indicators 2018.
Home country bias is defined as “the tendency for investors to invest the majority of their portfolio in domestic equities, ignoring the benefits of diversifying into foreign equities.”1 Historically, this bias was attributed to legal and logistical difficulties in buying foreign stocks. Today, by contrast, a broad range of mutual funds and ETFs allow U.S. investors to extend their reach overseas yet pronounced home bias persists. Likelier explanations for this effect today involve familiarity, salience, availability, and other behavioral biases. While U.S. investors are perhaps the guiltiest, even investors in countries with smaller stock markets with less stellar performance than the United States consistently exhibit bias. Given low transaction costs and improved international information and reporting standards, it makes sense for investors—wherever they are located—to take advantage of diversification opportunities and to think globally when building equity portfolios.
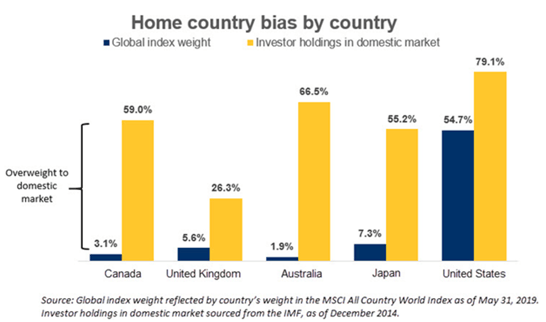
Image source: RBC (https://www6.royalbank.com/en/di/hubs/investing-academy/article/home-country-bias/jy4l8s2k)
A global approach to equity investing allows for greater economic and industrial diversification through ownership of the world’s best companies, unhindered by the constraints of regional mandates or local benchmark. There are more than 43,000 public companies worldwide, many of which derive significant revenues outside of their home market. The multinational nature of supply and distribution chains and the interconnectedness of global markets argue for an approach evaluates companies on an equivalent basis, irrespective of their nominal country of domicile. Further, this investable universe is constantly expanding. The IMF recognizes 189 sovereign countries, and a full 80% can be classified as developing economies. We believe patient investors will uncover many of the next decade's best growth stories in these markets.
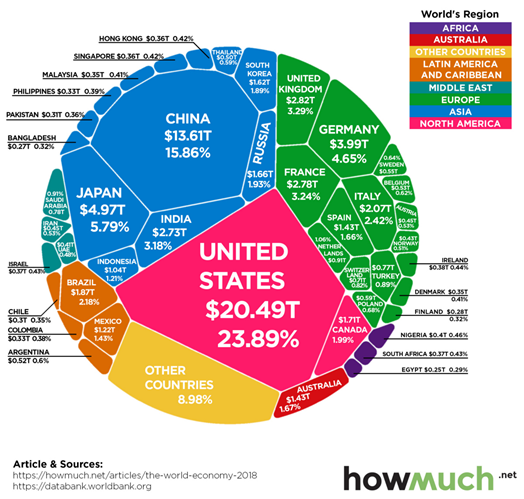
The recent relative strength of our domestic stock market has pushed the United States’ share of the global equity benchmark to nearly 58%. Japan comes in a distant second, at 7%. The dominant weighting of the U.S. market relative to the rest of the world has been a decades-long phenomenon, save for a brief moment at the peak of Japan’s late-‘80s equity bubble, when the Land of the Rising Sun held a 44% weight. Japan ultimately suffered a ten year period (1991-2001) of economic stagnation, famously referred to as its “Lost Decade,” and its Nikkei stock index has yet to surpass its all-time high set in late 1989.
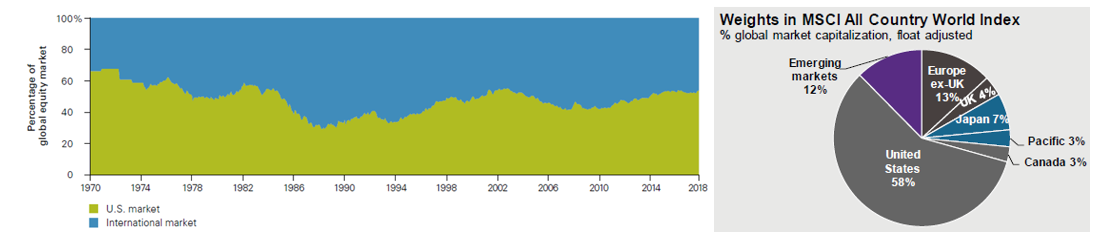
Image sources: Vanguard (https://www.vanguard.com/pdf/ISGGEB.pdf), J.P. Morgan Guide to the Markets (https://am.jpmorgan.com/us/en/asset-management/gim/adv/insights/guide-to-the-markets)
Despite this backdrop, some of the world’s top performing stocks over the last decade have come from outside of the dominant U.S. market, with China and emerging markets offering a substantial share. In a world where American public companies are outnumbered by nearly ten to one, investors hoping to find the next Google or Visa must look globally in order to maximize their chances.
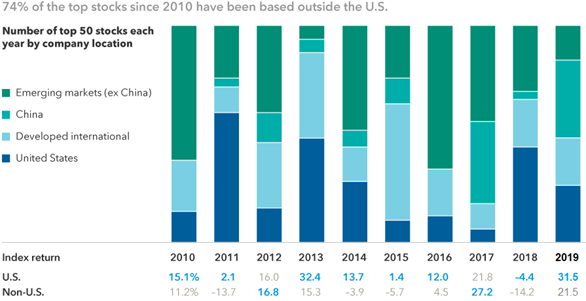
Image source: Capital Group (https://www.capitalgroup.com/advisor/insights/articles/international-outlook.html)
Technology stocks have driven the performance gap. They may not do so forever.
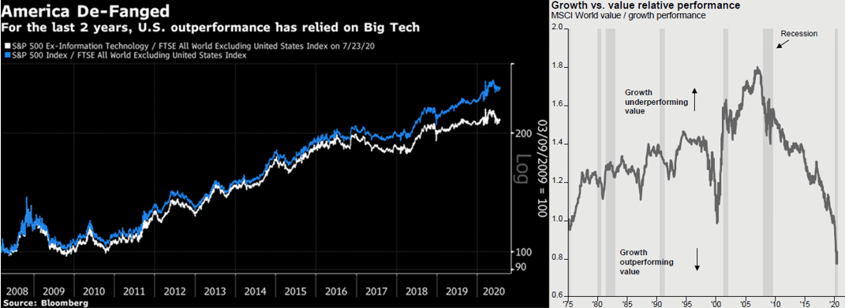
Image sources: Bloomberg, J.P. Morgan Guide to the Markets
The 2000s were effectively a lost decade for U.S. equity investors, as stocks suffered through the bursting of the dot-com bubble in early 2000 and the Great Financial Crisis (GFC) that lasted from late 2007 to early 2009. U.S. equities posted a dismal -1% annualized return during the 2000’s but roared back with +13% compound growth over the following decade. This performance was boosted by the heady profits raked in by big tech and combined with generous valuations afforded by easy monetary policies by the Federal Reserve. International stocks, as measured by the MSCI ACWI ex-US Index, added a modest +5% annually over the same period. U.S. dominance, however, has largely come from a select few companies with very little breadth outside of the technology sector. The ten largest holdings in the S&P 500 by market cap, a list including AAPL, AMZN, FB, GOOG, and MSFT, reached a record high 29% in July 2020.
Another theme that has worked well for American investors since the GFC has been growth over value. Despite the propensity of cyclical value stocks to do well during prolonged economic expansions, the recent low-growth, low-productivity recovery has put a premium on companies with sustained high earnings growth. While favoring U.S. over international stocks, and growth over value stocks may appear to be separate decisions, they are, in fact, related. A look at the composition of the world’s major market benchmarks shows that the S&P 500 is essentially a growth index, with much higher allocations to traditional growth sectors than the rest of the world. As of August 31st, the price-earnings ratio of the S&P 500 stood at 25.2x while the MSCI All Country World Index-ex U.S. had a multiple of “only” 18.2x. The U.S. contributes largely information technology and healthcare companies to the global index, while value sectors such as energy, materials, and financials are overrepresented in non-U.S. markets. If the global economy recovers from its coronavirus doldrums, these latter sectors are likely to take the lead.
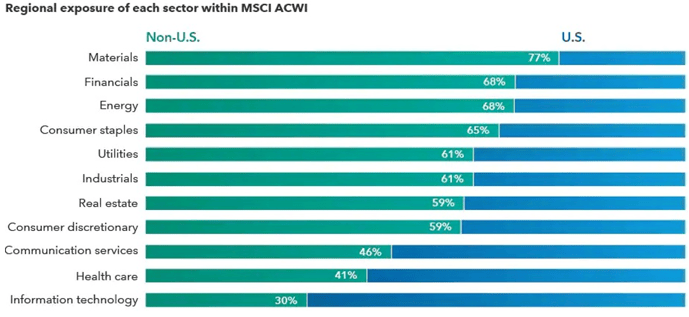
Image source: Capital Group
A decade of ascendancy of domestic technology stocks has deterred many investors from broadening international exposure. Though some trends that have favored American megacap platform companies remain intact, recent history may be a poor guide to the future. A quote attributed to hockey legend Wayne Gretzky advises, “Skate to where the puck is going to be, not where it has been.” Investors who missed out on the opportunity of the 2010s and pile into story stocks at eyewatering multiples give the impression of youth soccer players chasing the ball in a mass of dust and bruised shins. We believe opportunities for outstanding equity performance still exist, but they are less likely to be found under the bright spotlight U.S. growth darlings find themselves. Investors looking to the future may need to think differently and with a global mindset. The question we should ask is what our future selves would wish we had done a decade ago. Surely, looking back, buying Amazon at a market cap of $50 billion (which it hit in July 2010) is a decision to be proud of. Buying today at $1.7 trillion may not look equally far-sighted in retrospect.
Not your father’s emerging markets
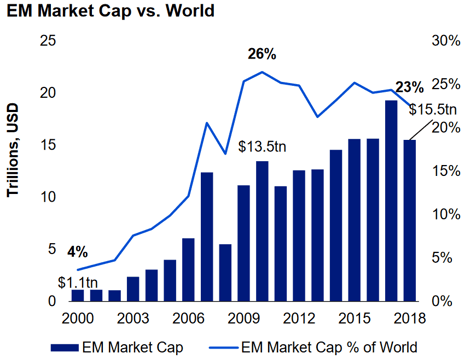
Image source: Invesco Oppenheimer (https://www.invesco.com/us-rest/contentdetail?contentId=145ea1d6c7500710VgnVCM1000006e36b50aRCRD
Emerging market equities represent roughly a quarter of worldwide market capitalization, a level that has largely remained stagnant over the last decade but is significantly higher than the four percent weighting registered in 2000. The BRIC countries of Brazil, Russia, India and China were poised to become the leading developing economies at the turn of the millennium; lately, the EM growth story within has now become largely Asia-centric. Asia represents nearly 70% of EM equity capitalization, up from 50% in 2010, while Latin America has seen its share fall from 28% to 13% over the same period. The rise of Asia and the stagnation of the rest of EM can be attributed mainly to China, which has transformed its business landscape from a dependence on doddering state-owned manufacturing and exporting concerns to a more dynamic model focused on services and domestic consumption boosted by a growing middle class.
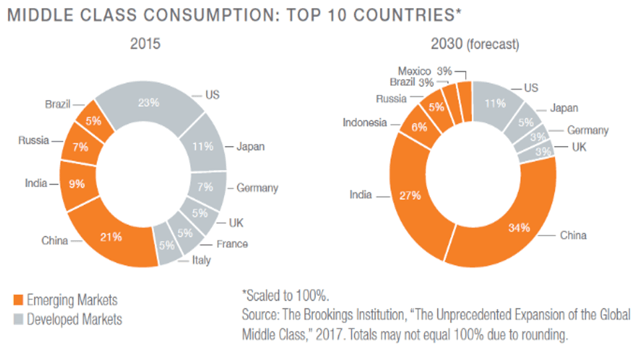
Image source: Mirae Asset Global Investments (https://investments.miraeasset.us/application/files/7815/7356/9819/GC_Brochure_Nov19.pdf)
While we do not believe that the United States will soon cease to be the world’s central economic power, demographic trends suggest that other countries are closing the gap, in part due to the growth of their middle-class consumer populations. The world’s share of middle class consumption is expected to shift from the major developed economies to emerging markets, led by the tandem of China and India. These rapid demographic changes may be viewed in the below chart, courtesy of JPMorgan, which highlights how some countries have seen their populations transform from a majority in poverty or even near-subsistence income levels to bourgeois consumer-capitalists in the span of a generation.
So what does this demographic shift mean for the global economy? Many Americans recall how the 1946 to 1964 “Baby Boom” heralded an unprecedented rise in domestic consumption and economic output, as new middle class households accumulated a new cornucopia of durable goods, in addition to improved health, education, and entertainment services. Consider now that while the U.S. had an estimated 79 million “Boomers” to propel its economy to where it is today, the number of middle-class consumers living in emerging market economies will number 3.2 billion by 2025. The Brookings Institution estimates that 88% of the world’s global middle class growth by 2025 will come from Asia, bringing the total spending power of this group to levels that surpass North America and Europe combined. In national terms, Brookings estimates that the 2030 middle class markets of China and India will account for $14.1 trillion and $12.3 trillion of respective economic power, versus the U.S projection of $15.9 trillion.
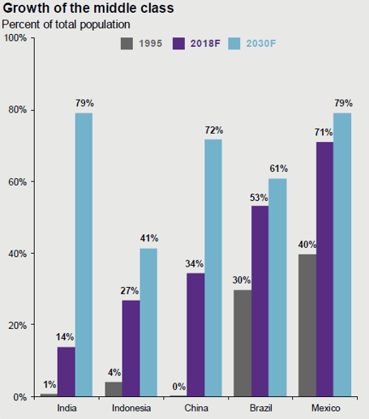
Image source: J.P. Morgan Guide to the Markets
China has undergone the most impressive change, becoming the world leader in bachelor degrees for science and engineering, and even receiving patents at a faster clip than the United States. This is a country that has essentially built, over the course of two decades, 113 cities with more than one million in population. For perspective, the 113th largest city in the United States is Santa Clarita, California, with a population of just over 210,000.2
India has the largest youth population in the world, with more than 600 million people under the age of 25 and more than a quarter of its total population aged fourteen or younger. It is not surprising that India boasts one of the world’s largest student enrollments in post-secondary education, many of whom will graduate with degrees in STEM (science, technology, engineering and mathematics) and with knowledge of the English language. More widely, nearly 44% of the population within emerging economies is under the age of 25, compared to just 27% in the developed world. These younger populations will allow for continued urbanization of major population centers as they travel from rural areas to these growing cities for educational opportunities and enhanced earning potential. Recent research confirms that workers and firms are much more productive in large urban centers than in small towns or the countryside. This holds especially true in the developing world.
Our thesis behind investing in emerging market equities centers on the increasing role of developing nations in underpinning global growth. According to IMF estimates, emerging economies are expected to grow two to three times faster than developed economies for the foreseeable future, and total GDP of emerging markets is projected to comprise an increasing majority of the world’s global economic output.3 Many emerging nations have adopted policies that are favorable for growth, and they should benefit from more competitive currencies and lower energy costs. Demographics and government debt dynamics also suggest supportive climates for growth compared to developed nations.
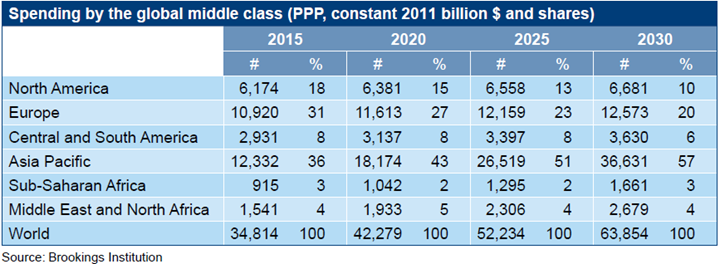
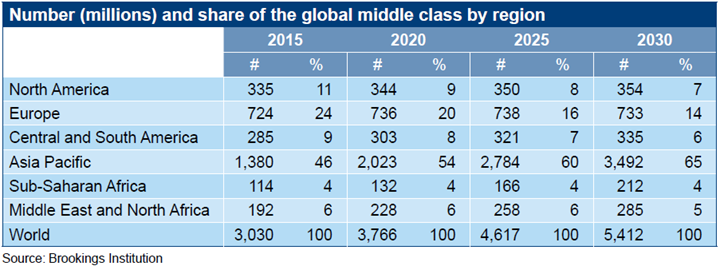
Image source: Brookings Institution (https://www.brookings.edu/wp-content/uploads/2017/02/global_20170228_global-middle-class.pdf)
Of course, faster growth does not by itself imply better stock market performance. Not only must the total market grow, but public firms must capture a sizeable share of that growth, and both domestic and international investors must reward these firms with stable multiples. Fortunately, in many emerging nations, corporate governance and financial reporting standards have improved markedly over the early part of the 2000s, financial liberalization is allowing greater access for international capital, and central banks have improved their performance in stabilizing inflation and currency values. Turkey and Venezuela are notable exceptions to this rule, but again, Asian economies have led the pack. For American investors, considering the effects of currency translation is of paramount importance, but a recent consensus has emerged that the dollar is, on a trade-weighted basis, overvalued.4 Over the longer run, emerging market stocks tend to have lower correlations to those in developed markets, which suggests diversification potential, and current valuations imply somewhat better expected returns in EM over a multiyear horizon. For these reasons and others, we think maintaining an allocation to emerging market stocks is prudent.
International small cap: A niche market?
While the number of publicly listed companies in the U.S. has been in steady decline, the universe of compelling micro-to-mid capitalization companies overseas is extensive and growing. It is estimated that over 70% of the world’s investible companies fall into this massive opportunity set, and non-U.S. companies’ dominant share of the global IPO market is expected to persist as new businesses are formed amid a growing middle class. The returns of these smaller companies are likely be driven more by their own idiosyncratic fundamentals than index-hogging behemoths whose fortunes fluctuate more with the macroeconomic and trade winds. This works to the benefit of stock-pickers, and we find strong performance persistence among top-quartile active managers with track records of identifying winning businesses.
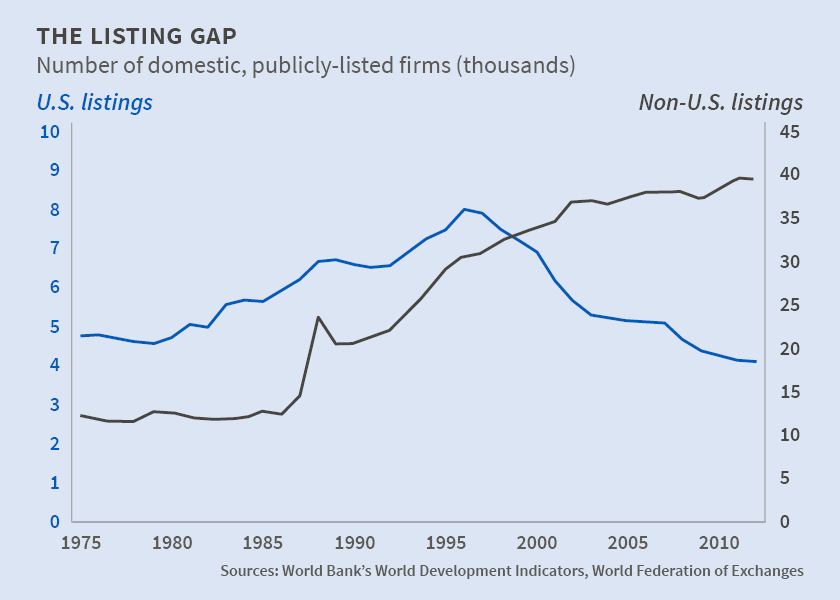
Image source: NBER (https://www.nber.org/digest/sep15/w21181.html)
We view the international small-cap equity universe as a less-efficient market. It comprises 20,000 companies, many of which have little or no analyst coverage by the world’s investment community. FactSet data estimate that around 30% of companies in the MSCI ACWI ex-USA Small Cap Index are covered by one or zero sell-side analyst. Here, active managers may enjoy a potential informational advantage. In fact, Morningstar data have shown that this market is one of the very few where the average active manager outperformed their benchmark over the last decade. According to MSCI, the international small cap index represents 22 of 23 developed market countries (excluding the US) as well as 26 emerging countries.5 This is truly an enormous sandbox in which investment managers may exercise considerable judgment.
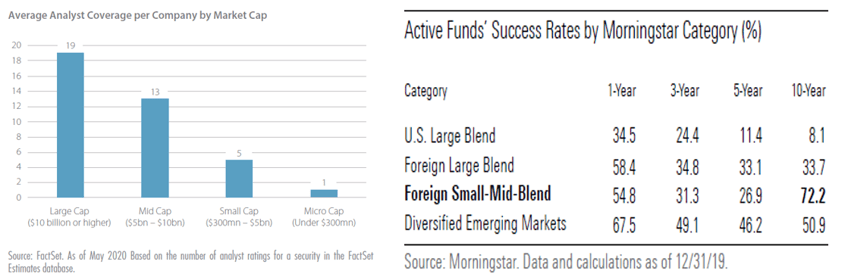
Image sources: Artisan Partners (https://www.artisanpartners.com/content/dam/documents/insights/vr/The-Case-for-International-Small-Caps-vR.pdf), Morningstar (https://www.morningstar.com/lp/active-passive-barometer)
When investing globally, active management makes increasing sense as market capitalization decreases. Active managers don’t just uncover gems—they avoid frauds, scams, or just mismanaged companies. Leading active management teams will perform hundreds of meetings annually with company management, their competitors or vendors, and even government officials to gain unique insight into a particular company or industry. Aligning this understanding with the qualitative and quantitative factors that drive stock prices is how good managers sort through an vast investible universe and distinguish from the many mediocre companies, those world-class ones that are worthy of investors’ capital.
Secular tailwinds for international stocks
Valuations – Beyond the growing emerging market middle class, there are additional factors that present a favorable backdrop for investing in non-U.S. stocks. The first is valuations, which reveal that U.S. stocks are much more expensive than their international counterparts. The valuation gap partly reflects the divide between growth and value discussed above. Indeed U.S. stocks are so pricey that they trade at levels two standard deviations above their 25-year average (15.4x) and at multiples last seen during the dot-com bubble.6 The fundamentals for both Europe and Emerging Markets are more attractive, as international stocks broadly trade at 17x next year’s earnings.
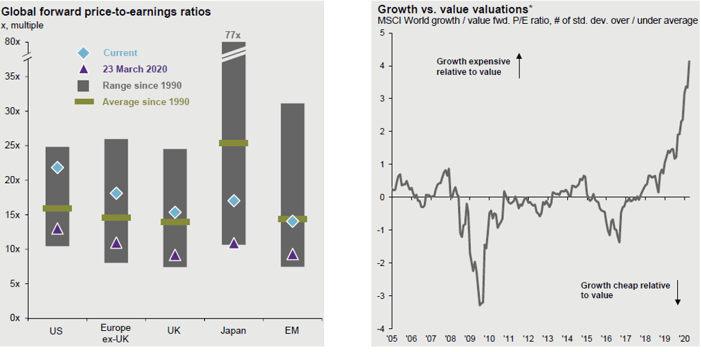
 Images source: J.P. Morgan Guide to the Markets
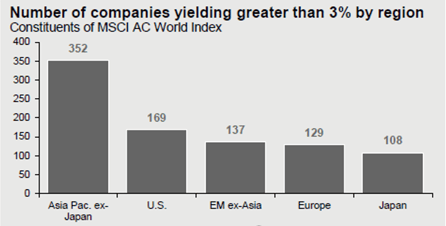
Yield – International diversification may also appeal to investors seeking income amid the current low-rate environment. International equities out-yield their U.S. counterparts 2.9% to 1.8%, respectively, when comparing the yield on the MSCI ACWI ex-U.S. to that of the S&P 500. Furthermore, the number of three percent or greater “high yielders” are more than four times more prevalent outside of the U.S. High yields may reflect depressed valuations, but they also ensure return-of-cash, which, ceteris paribus, decreases the volatility and risk faced by an investor. Unlike fixed income, high corporate earnings yields should in theory grow at least as fast as inflation, making international equities a worthwhile stop for investors concerned about real income.
Dollar weakness – The recent multiyear strength of the U.S. dollar has been quite the headwind for dollar-denominated investments in foreign stocks; however, there are signs that the dollar could weaken as the United States’ share of global GDP continues to shrink. EM currencies are particularly undervalued versus the U.S. dollar by historical standards.
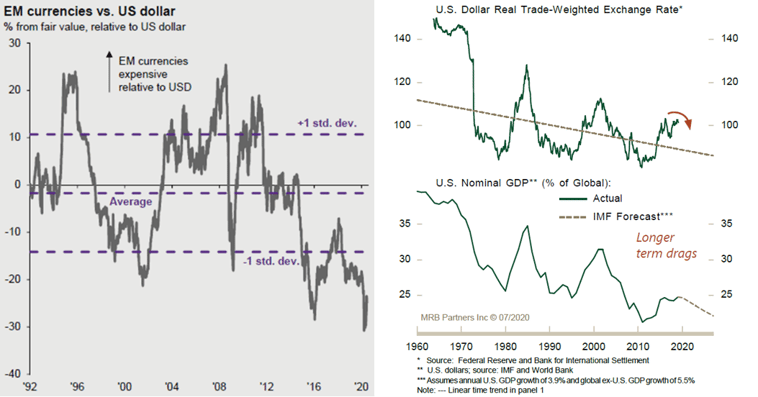 Image sources: J.P. Morgan Guide to the Markets and MRB Partners
July saw a 4% decline for the greenback against a basket of currencies—the dollar’s largest monthly decline in a decade. Soaring U.S. debt levels and increasing political dysfunction have cast some doubt on the dollar’s future as the world’s reserve currency. China appears increasingly as a rival to America as a global financial hegemon, while a recent European common debt issuance looks to have tamed some of the centrifugal forces that held back broader acceptance of the euro in finance and trade. While we believe that the euro or yuan must still come a long way to be in the discussion for reserve currency status, the dollar’s continued reign is evidently less sure than it has been in decades. A U.S. federal deficit stands at $3 trillion and rising, while U.S. real rates are no longer substantially higher than those on offer elsewhere. These factors are likely to continue to stress the dollar to the chagrin of foreign holders of U.S. assets. The resulting flow of capital away from the U.S. could represent a tailwind for investors in less frothy international financial markets.
COVID-19 and the bigger picture
The coronavirus global pandemic has exacerbated many divides—political, social, and economic. One that will provoke reflection and discussion for years is the relatively poor performance of the United States in handling the public health crisis when compared with other rich countries. We would rather leave the postgame analysis to a later date, but, suffice to say, international economies are finding their footing more swiftly than the United States’. The crisis has clearly illustrated how political dysfunction is not the sole preserve of developing countries and, in fact, appears to be evidence of the vitality of many Asian nations’ models of government.
Despite this perhaps surprising discrepancy, U.S. stocks have pressed their advantage in the wake of COVID-19. Why? The U.S. is highly concentrated in telecommunications and e-commerce giants such as Amazon and Netflix, which have been net beneficiaries of the pandemic. Conversely, the rest of the world is heavily weighted towards industrials, commodity exporters and banks, sectors hit rather harder by the virus. It is clear that the U.S. has a lead in many innovative or strategic sectors beloved of investors. It is less clear that the lead will last. At some point, COVID-19 will be a memory, and international focus will turn to the challenges of resetting the global trading system, tackling climate change, and addressing long-term healthcare disparities. It is likely that many of the leading solutions will come from outside the U.S., and early, selective investors will be rewarded. Demographics suggest that structural changes are occuring in other parts of the world which will result in the broadening of technological and business frontiers well beyond our backyard. As fiduciaries of our clients’ assets charged with preserving and growing wealth over periods measured in decades, we look to allocate capital toward areas where the risk/reward tradeoffs are favorable in the long run. International equities must be an element of this calculus.
1 https://www.investopedia.com/terms/h/homebias.asp
2 https://worldpopulationreview.com/us-cities
3 IMF World Economic Outlook 2019 (https://www.imf.org/en/Publications/WEO/Issues/2019/01/11/weo-update-january-2019), pp. 29-30, 81.
4 For examples, see https://www.economist.com/news/2020/07/15/the-big-mac-index, or https://www.cnbc.com/2019/07/18/imf-sees-dangers-from-trade-tensions-says-usd-is-overvalued.html.
5 https://www.msci.com/documents/10199/94076f89-3150-4ff7-8e64-be41786b969f
6 Standard deviation is a measure of how “spread out” a distribution is around its mean. In a Gaussian, or bell curve-shaped financial world (in which we increasingly no longer live), a (positive) two-standard-deviation-event should occur roughly 2.5% of the time.
Related Posts
Time to Buy?
No. Decades of low inflation and falling real yields pushed up valuation multiples across all...
Keep Calm ...
... But Mind the Speculative Unwind and Position Cautiously
Investment Strategy: a Major Reset
- The Fed clearly sees more risk coming from higher inflation than it does from a potential...